This analysis has one ambition: tell what is happening in the 2026 season itself, not retell the post-Covid story. We cross three sources: official HCAA statistics for 2024, 2025 and Jan-Feb 2026 (clean iso-airport YoY), cross-referencing 5,067 properties between Inside Airbnb and our Kairos May 2026 ADR snapshots, and seasonal press monitoring.
1. Iso-airport YoY (the only meaningful comparison)
Comparing Heraklion to Chania makes no sense — they are infrastructures of different sizes. The only comparison that measures a real trend is each airport against itself, month by month, year by year.
Heraklion (HER) — pax_total iso-airport
| Month | 2024 | 2025 | 2026 | YoY 24→25 | YoY 25→26 |
|---|---|---|---|---|---|
| January | 116,869 | 136,547 | 138,983 | +16.8% | +1.8% |
| February | 96,267 | 125,635 | 149,435 | +30.5% | +18.9% |
Chania (CHQ) — pax_total iso-airport
| Month | 2024 | 2025 | 2026 | YoY 24→25 | YoY 25→26 |
|---|---|---|---|---|---|
| January | 58,442 | 63,751 | 68,516 | +9.1% | +7.5% |
| February | 64,357 | 60,234 | 69,517 | -6.4% | +15.4% |
| March (Fraport) | 76,268 | 76,433 | 83,681 | +0.2% | +9.7% |
Three facts that deserve attention
HER: +18.9% passengers in February 2026 vs February 2025. CHQ: +15.4% in February, +9.7% in March. International at CHQ: +115% in March 2026 vs March 2025 — the doubling signals the early return of European low-cost carriers.
2. The season spreads, the peak no longer grows
This is the most important pattern of the year. Looking at YoY 2024→2025 growth by month for the whole of Crete:
| Month | 2024 | 2025 | YoY 24→25 |
|---|---|---|---|
| January | 175,311 | 200,298 | +14.3% |
| February | 160,624 | 185,869 | +15.7% |
| April | 674,975 | 794,773 | +17.7% |
| May | 1,447,015 | 1,490,563 | +3.0% |
| June | 1,923,702 | 2,015,800 | +4.8% |
| July | 2,335,675 | 2,423,005 | +3.7% |
| August | 2,362,315 | 2,522,132 | +6.8% |
| October | 1,475,483 | 1,616,527 | +9.6% |
| November | 303,115 | 333,598 | +10.1% |
| December | 225,570 | 253,079 | +12.2% |
The pattern that changes everything
Shoulder months (Jan, Feb, Apr, Oct, Nov, Dec) gain +10 to +18% per year. May and the June-August peak plateau at +3 to +7%. Crete's tourist season is spreading in time. The July-August peak remains capacity-bound. For owners, May and October deserve the same pricing effort as June — they are not yet treated as such by most of the market.
3. Forecast 2026 by month
| Month | 2024 actual | 2025 actual | 2026 forecast | Growth |
|---|---|---|---|---|
| April | 5,844 | 6,991 | 7,746 | +10.8% |
| May | 10,163 | 11,747 | 13,311 | +13.3% |
| June | 14,443 | 17,106 | 19,049 | +11.4% |
| July | 19,628 | 22,460 | 24,672 | +9.9% |
| August | 23,003 | 25,438 | 28,259 | +11.1% |
| September | 19,872 | 16,671 | 19,553 | +17.3% |
Key reading
May has the steepest projected slope: +13.3%. Consistent with the spreading-season pattern. July and August have the lowest slopes (~+10%) — the peak is saturated in physical capacity. Convergence with HER+CHQ Jan-Feb 2026 airports +1.8% to +18.9%, March CHQ +9.7%.
4. The market has priced +10% in eight months
- Mean ADR delta: +€13.5/night (+9.6% median).
- 64% of properties raised their price.
- 28.6% lowered their price.
- 7.4% remained stable.
Direct consequences
If you keep your 2025 price without revision, you leave around 10% of revenue on the table. If you raise more than 15-20% without product improvement, you risk losing bookings. The 28.6% who lowered are often those with weak 2025 occupancy — a product or marketing issue, not just pricing.
5. Implications for May 2026
For owners renting out
- 1May and October take all the growth. May 2026 is a fully exploitable month at near-peak pricing on well-positioned zones.
- 2The market priced +10% since September 2025. Not revising = leaving 10% of revenue on the table.
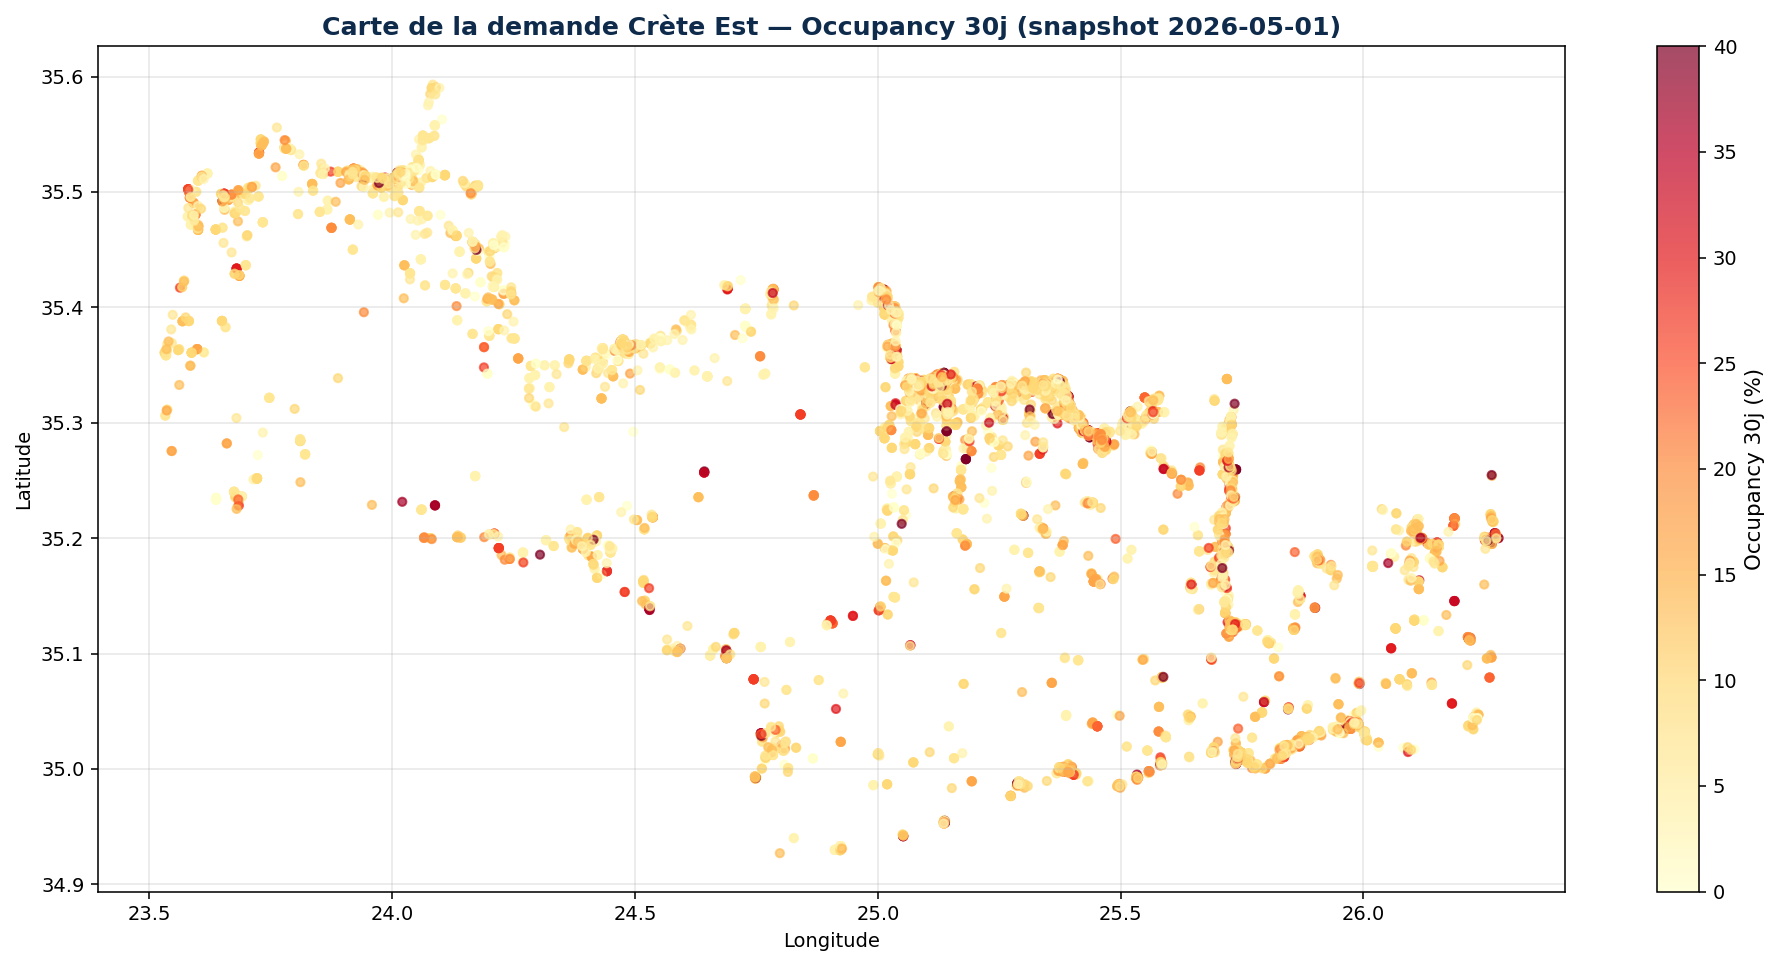
- 330-day forward booking is your best instant indicator. Eastern Crete median = 3 nights/30. Above zone p75 = you can raise the price.
- 4The July-August peak is no longer growing (+3 to +7% per year). Invest in shoulder months.
For investors buying
- 1Eastern rural Crete (Sitia, Ierapetra, Mochlos) remains undervalued in ADR but with demand that holds up. Contrarian investment.
- 2Classic tourist centers (Chania, Heraklion city): slowing growth. Buy differentiated or nothing.
- 3Local press flagged real estate auto-correction. Properties overvalued since 2024 stagnate — time to negotiate.
Need personalized guidance?
We'll prepare a tailored estimate for your investment project in Crete.
Book a discovery callReady to take action?
Let's talk about your project
15 minutes, no commitment. We listen to your project and tell you exactly how we can help.